Monitors
Uptime checks from multiple regions, with a clear down rule
Website and API checks
HTTP and HTTPS monitoring with status codes, response-body and latency assertions, plus keyword, ping, TCP, DNS, SSL expiry, and heartbeat checks.
Multiple regions
Six regions worldwide. Each monitor checks from up to six of them (three on the free plan), and at least two must agree before anyone is paged.
Consensus alerts
An incident opens only when at least two of the checked regions agree your target is down in the same round. Included on every plan, free included.
Dev-first
A clean dashboard plus a REST API, CLI, and MCP so you can manage monitors from code, the terminal, or agents.
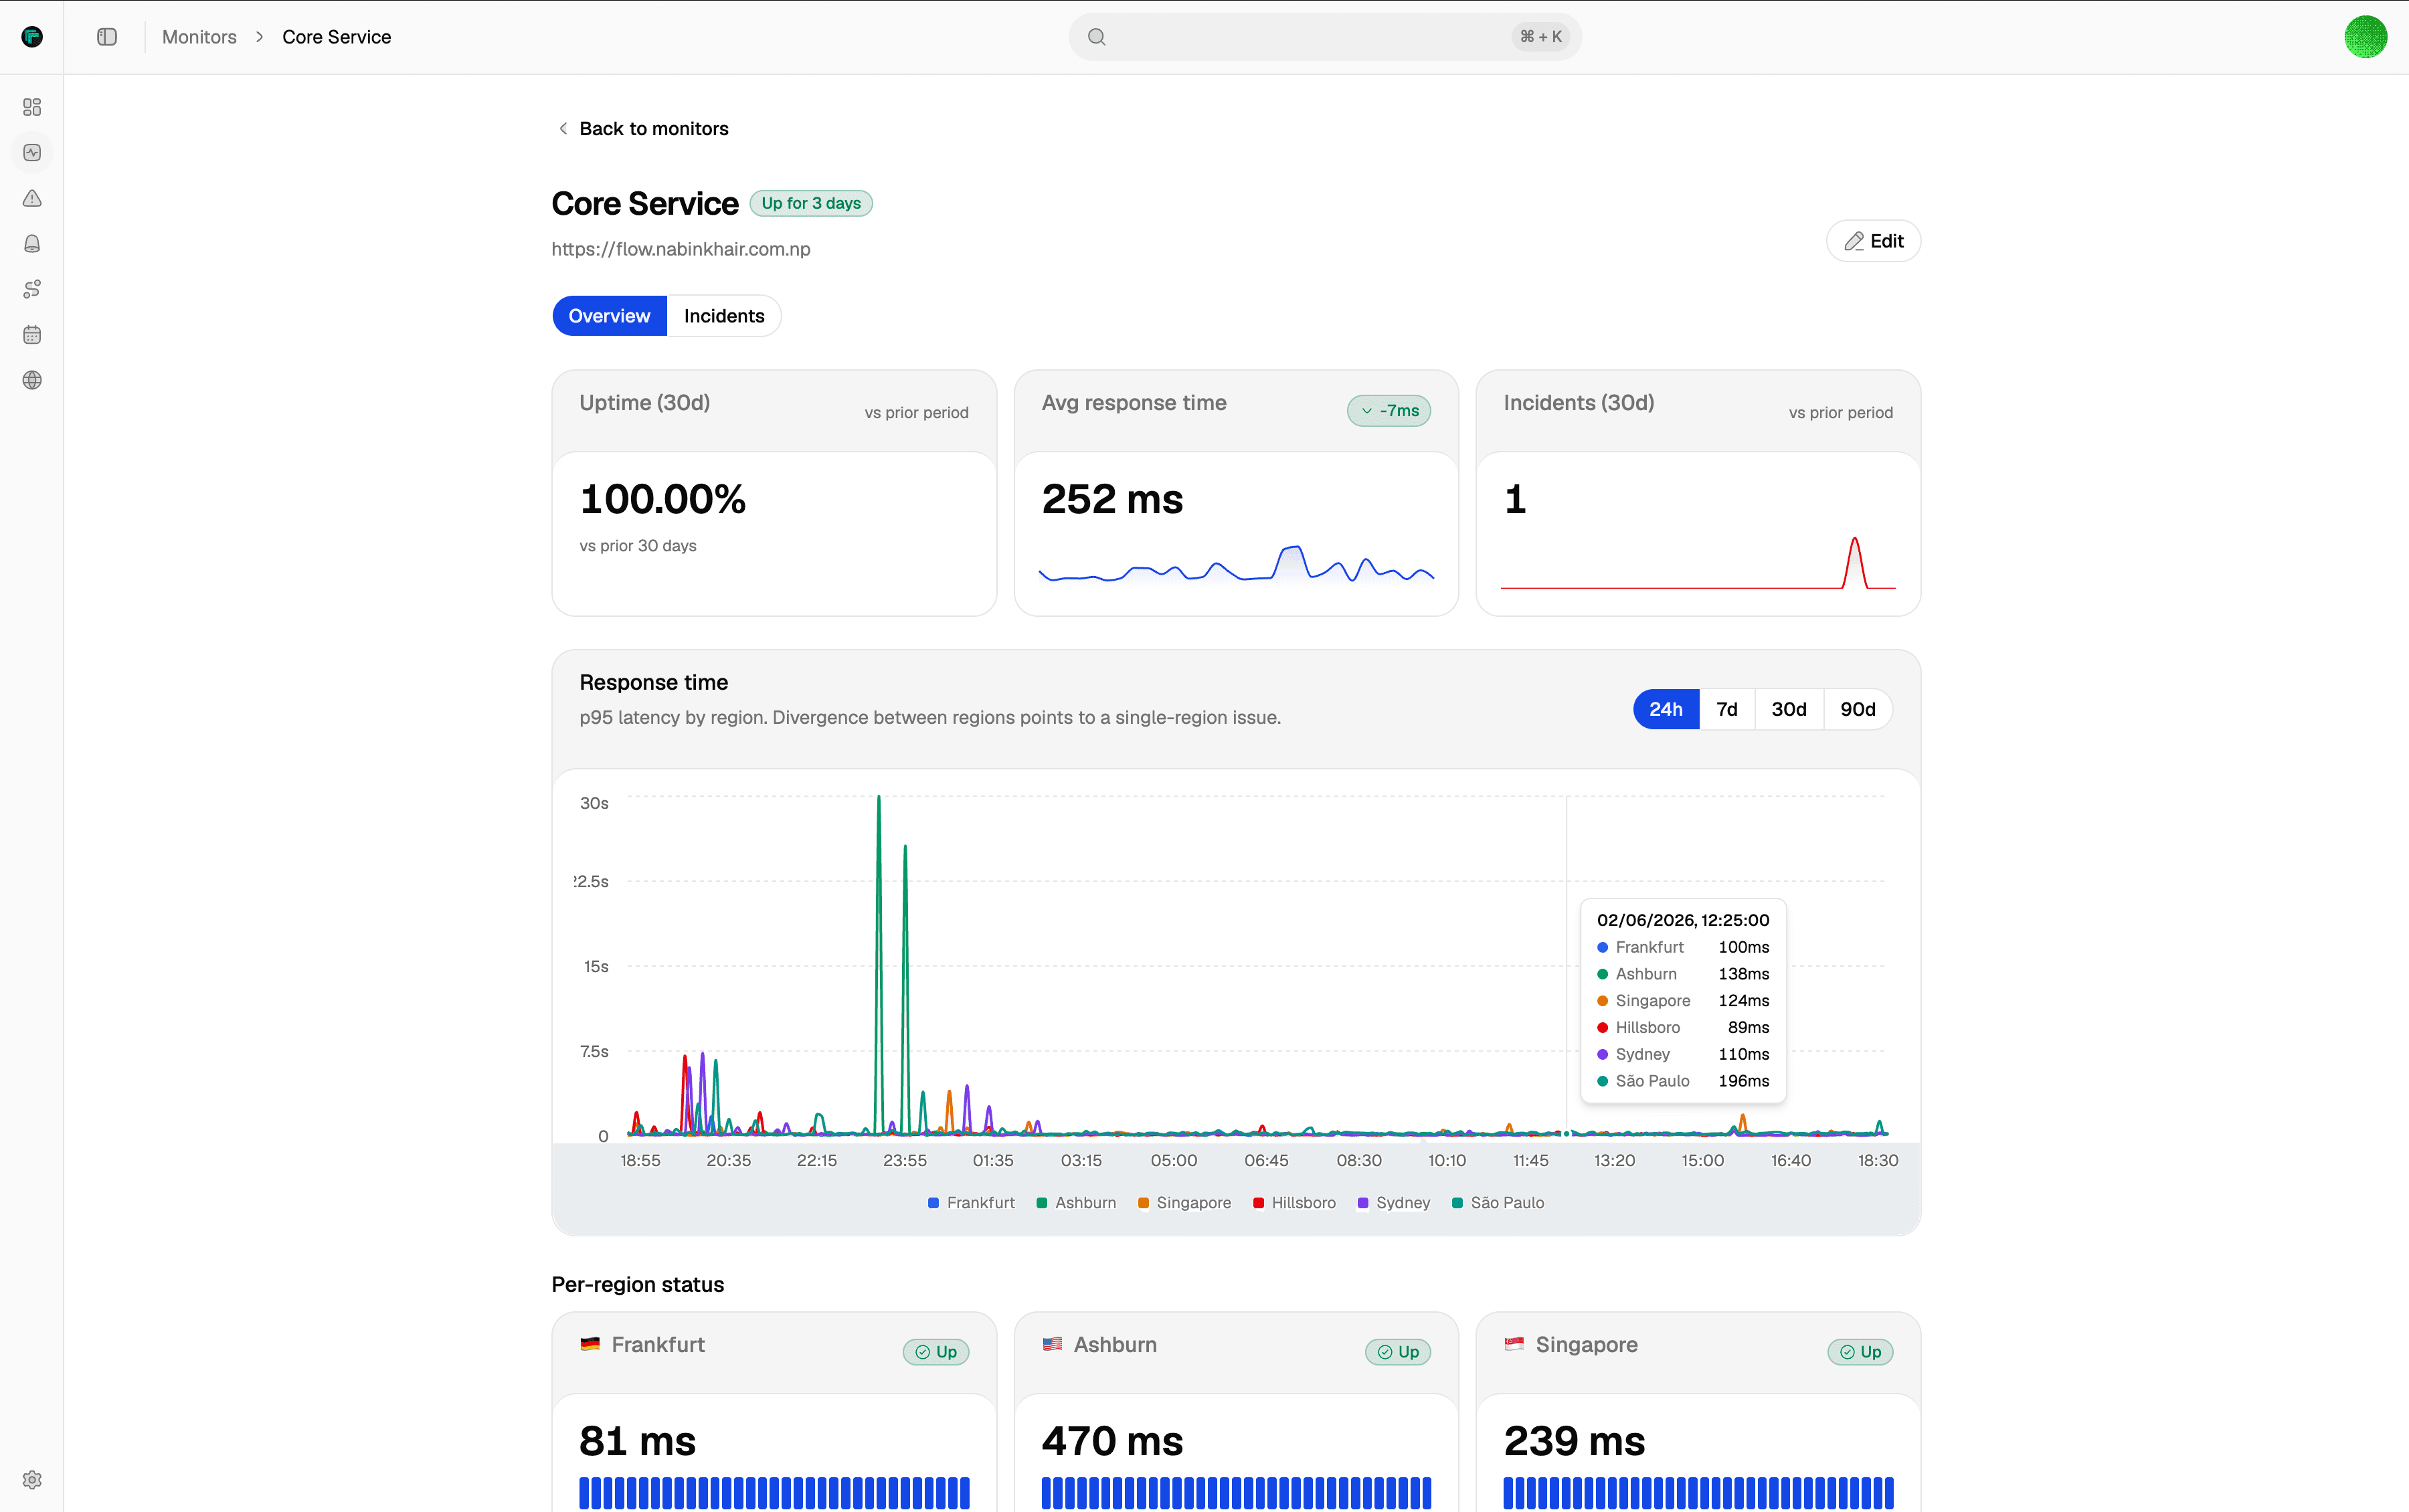
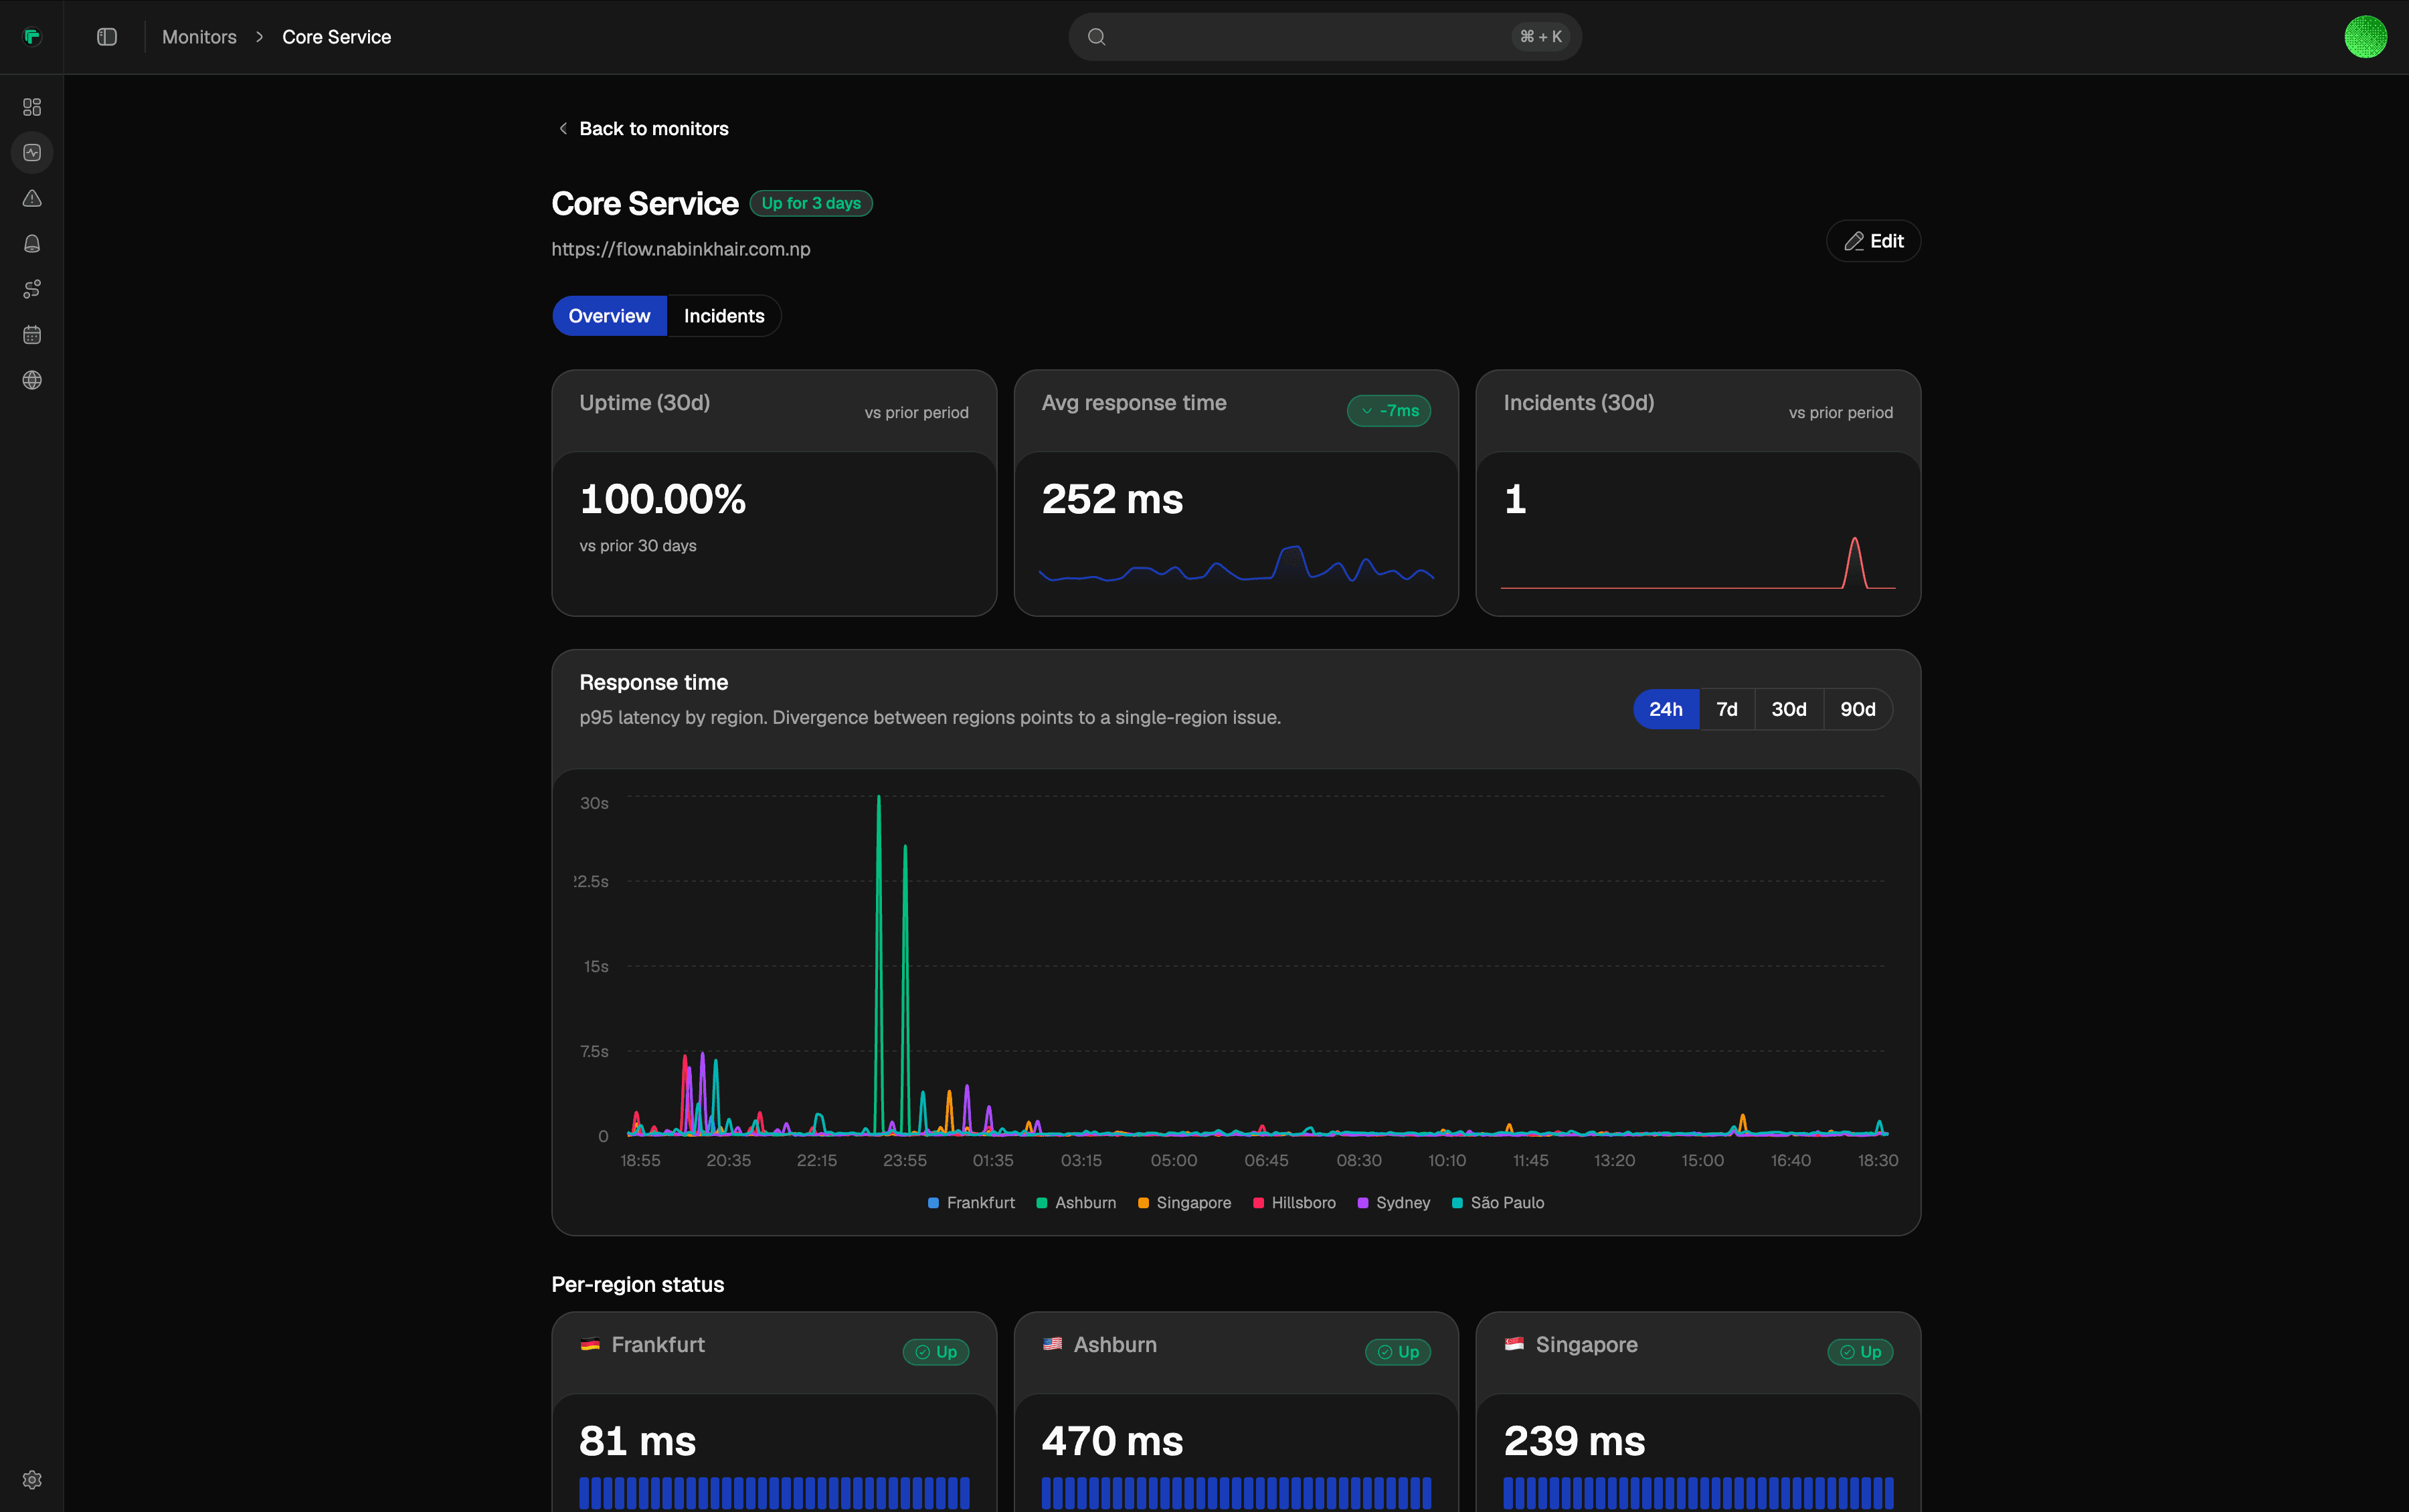
Setup
Set it up in a minute. Edit it anytime.
A monitor is just configuration. Name it, pick what to check, and choose where it runs. Change any of it later without starting over.
Point it at a target
Add a URL, host, or heartbeat. HTTP checks can assert on status codes, response body, headers, and latency — so a soft 200 that still means broken can page you.
Choose your regions
Run every check from up to six regions worldwide (three on the free plan). Heartbeats are passive check-ins and do not need a region quorum.
Consensus, by default
Every multi-region monitor opens an incident only when at least two of the checked regions agree the target is down in the same round. No extra setup — that is the default.
Edit it anytime
Interval, regions, and what you check are all editable later. Nothing is recreated, so the monitor keeps its history.
FAQ
Uptime monitoring, answered
What teams ask before they point their website and API monitoring at Tallwatch.
Related reading
Go deeper on how Tallwatch monitors
The thinking behind consensus alerts, multi-region checks, and running uptime monitoring for free.
Multi-region consensus monitoring
How Tallwatch pages only when at least two regions agree a check failed.
What Tallwatch is and how uptime monitoring works
A plain-language tour of consensus monitoring for websites and APIs.
Multi-region monitoring, explained
Why checking from several regions at once turns flaky alerts into real ones.
Free uptime monitoring you can run in production
What the free plan covers and why it is built for real projects.
Documentation
Setup guides
Step-by-step docs on docs.tallwatch.com for this part of the product.
How Tallwatch checks work and how to configure them.
Check types Tallwatch offers and how each is evaluated.
HTTP setup: assertions, regions, intervals, testing, and pausing.
Suppress downstream pages when an upstream monitor is already down.
Schedule planned downtime so deploys do not open incidents.
A page after regions agree — not after one probe fails.
Start on Free with multi-region consensus. No credit card.